Querying Snuba
This guide drives you through the process of authoring and testing a Snuba query.
Exploring the Snuba data model
In order to architect a Snuba query, the first step is being able to know which Dataset you should query, which Entities you should select, and what the schema of each Entity is.
For an introduction about Datasets and Entities, see the Snuba Data Model section.
Datasets can be found in this module. Each Dataset is a class that references the Entities.
The list of entities in the system can be found via the snuba entities
command:
snuba entities list
would return something like:
Declared Entities:
discover
errors
events
groups
groupassignee
groupedmessage
.....
Once we have found the entity we are interested into, we need to understand the schema and the relationship declared on that entity. The same command describes an Entity:
snuba entities describe groupedmessage
Would return:
Entity groupedmessage
    Entity schema
    --------------------------------
    offset UInt64
    record_deleted UInt8
    project_id UInt64
    id UInt64
    status Nullable(UInt8)
    last_seen Nullable(DateTime)
    first_seen Nullable(DateTime)
    active_at Nullable(DateTime)
    first_release_id Nullable(UInt64)

    Relationships
    --------------------------------
        groups
        --------------------------------
        Destination: events
        Type: LEFT
            Join keys
            --------------------------------
            project_id = LEFT.project_id
            id = LEFT.group_id
Which provides the list of columns with their type and the relationships to other entities defined in the data model.
Preparing a SnQL query for Snuba
Snuba query language is called SnQL. It is documented in the The SnQL query language section. So this section does not go into details.
There is a python sdk that can be used to build Snuba queries and it can be used in any Python client including Sentry. This is where the sdk project is documented.
The query is represented as a Query object like:
query = Query(
    dataset="discover",
    match=Entity("events"),
    select=[
        Column("title"),
        Function("uniq", [Column("event_id")], "uniq_events"),
    ],
    groupby=[Column("title")],
    where=[
        Condition(Column("timestamp"), Op.GT, datetime.datetime(2021, 1, 1)),
        Condition(Column("project_id"), Op.IN, Function("tuple", [1, 2, 3])),
    ],
    limit=Limit(10),
    offset=Offset(0),
    granularity=Granularity(3600),
)
For simpler datasets, there may not exist an entity. In this case, we can query the storage directly like:
query = Query(
    dataset="profiles",
    match=Storage("profile_chunks"),
    select=[
        Column("chunk_id"),
    ],
    where=[
        Condition(Column("start_timestamp"), Op.GT, datetime.datetime(2021, 1, 1)),
        Condition(Column("end_timestamp"), Op.LT, datetime.datetime(2021, 1, 2)),
        Condition(Column("project_id"), Op.IN, Function("tuple", [1, 2, 3])),
    ],
    limit=Limit(10),
    offset=Offset(0),
)
More details on how to build a query are in the sdk documentation.
Once the query object is ready it can be sent to Snuba.
Preparing a MQL query for Snuba
Snuba metrics query language is called MQL. It is documented in the The MQL query language section. So this section does not go into details.
Similar to SnQL, there is a python sdk that can be used to build queries
The metrics query is represented as a MetricsQuery object like:
query = MetricsQuery(
    query=Formula(
        ArithmeticOperator.DIVIDE.value,
        [
            Timeseries(
                metric=Metric(
                    public_name="transaction.duration",
                ),
                aggregate="sum",
            ),
            1000,
        ],
    ),
    start=NOW,
    end=NOW + timedelta(days=14),
    rollup=Rollup(interval=3600, totals=None, granularity=3600),
    scope=MetricsScope(
        org_ids=[1], project_ids=[11], use_case_id="transactions"
    ),
    limit=Limit(100),
    offset=Offset(5),
)
More details on how to build a query are in the sdk documentation.
Once the query object is ready it can be sent to Snuba the same wasy as SnQL.
Sending a query to Snuba with Sentry
The most common use case when querying Snuba is via Sentry. This section explains how to build a query in the Sentry code base and send it to Snuba.
Sentry imports the Snuba sdk described above. This is the recommended way to build Snuba queries.
Once a Query object has been created the Snuba client api provided by
Sentry can and should be used to send the query to Snuba.
The api is in this module. It takes care of caching, retries and allows bulk queries.
The method returns a dictionary that contains the data in response and additional metadata:
{
    "data": [
        {
            "title": "very bad",
            "uniq_events": 2
        }
    ],
    "meta": [
        {
            "name": "title",
            "type": "String"
        },
        {
            "name": "uniq_events",
            "type": "UInt64"
        }
    ],
    "timing": {
        ... details ...
    }
}
The data section is a list with one dictionary per row. The meta
section contains the list of the columns included in the response with
their data type as inferred by Clickhouse.
More details about the structure of the timing section below.
Sending a test query through the web UI
Snuba has a minimal web UI you can use to send queries. You can run Snuba
locally and the web UI will be accessible at http://127.0.0.1:1218/[DATASET NAME]/snql.
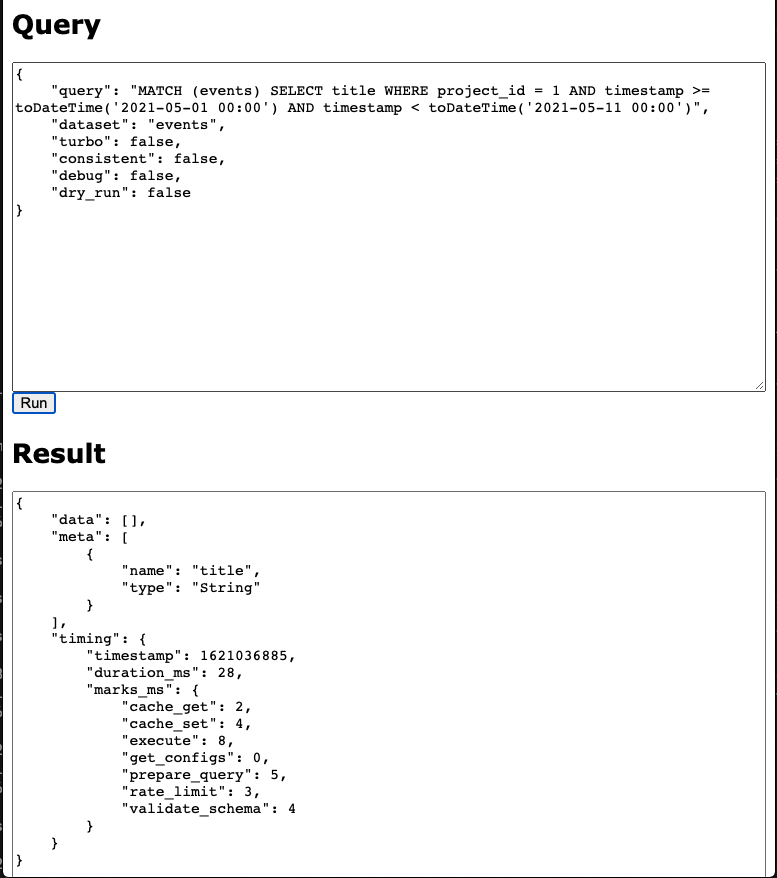
The SnQL query should be provided (sorry, on one line only) in the query attribute and the structure of the response is the same discussed in the section above.
Sending a query via curl
The web ui just sends the payload as a POST. So the same result can be achieved with curl or any other HTTP client.
Request and response formats
The request format is the same visible in the screenshot:
querycontains the SnQL query as a stringdatasetis the dataset name (if not already specified in the urldebugmakes Snuba provide exhaustive statistics in the responseincluding the Clickhouse query.
consistentforces the Clickhouse query to be executed in singlethreaded mode and, in case the Clickhouse table is replicated, it will force Snuba to always hit the same node. Which can guarantee sequential consistency as that is the node where the consumer write by default. This is achieved with the load balancing Clickhouse property which is set as
in_order.
turbosets a sampling rate to the query defined in theTURBO_SAMPLE_RATESnuba setting. It also prevents Snuba to apply the
FINALmode to the Clickhouse query in case it was needed to guarantee correct results after replacements.
Snuba can respond with 4 http codes. 200 is for a successful query, if the query cannot be properly validated it will be a 400. A 500 generally means a Clickhouse related issue (that go from timeout to connection issues) though there are several invalid queries that Snuba is not able to identify in advance still (we are removing them). Snuba has an internal rate limiter so 429 is also a possible return code.
The response format for a successful query is the same discussed above. The complete version looks like this (in debug mode)
{
    "data": [],
    "meta": [
        {
            "name": "title",
            "type": "String"
        }
    ],
    "timing": {
        "timestamp": 1621038379,
        "duration_ms": 95,
        "marks_ms": {
            "cache_get": 1,
            "cache_set": 4,
            "execute": 39,
            "get_configs": 0,
            "prepare_query": 10,
            "rate_limit": 4,
            "validate_schema": 34
        }
    },
    "stats": {
        "clickhouse_table": "errors_local",
        "final": false,
        "referrer": "http://127.0.0.1:1218/events/snql",
        "sample": null,
        "project_rate": 0,
        "project_concurrent": 1,
        "global_rate": 0,
        "global_concurrent": 1,
        "consistent": false,
        "result_rows": 0,
        "result_cols": 1,
        "query_id": "f09f3f9e1c632f395792c6a4bfe7c4fe"
    },
    "sql": "SELECT (title AS _snuba_title) FROM errors_local PREWHERE equals((project_id AS _snuba_project_id), 1) WHERE equals(deleted, 0) AND greaterOrEquals((timestamp AS _snuba_timestamp), toDateTime('2021-05-01T00:00:00', 'Universal')) AND less(_snuba_timestamp, toDateTime('2021-05-11T00:00:00', 'Universal')) LIMIT 1000 OFFSET 0"
}
The timing section contains the timestamp of the query and the duration. What
is interesting is that the duration is broken down into phases: marks_ms.
The sql element is the Clickhouse query.
The stats dictionary contains the following keys
clickhouse_tableis the table picked by snuba during query processingfinaltells if Snuba decided to send a FINAL query to Clickhouse which would forceClickhouse to apply the relevant merges (for merge trees) right away. Details
sampleis the sampling rate appliedproject_rateis the number of request per second Snuba received for the specificproject at the time of the query
project_concurrentis the number of concurrent query involving the specific projectat the time of the query.
global_ratesame as forproject_ratebut not focused on one projectglobal_concurrentsame as forproject_concurrentbut not focused on one projectquery_idis a unique identifier for the this query.
A query validation issue would generally have this format:
{
    "error": {
        "type": "invalid_query",
        "message": "Missing >= condition with a datetime literal on column timestamp for entity events. Example: timestamp >= toDateTime('2023-05-16 00:00')"
    }
}
A Clickhouse error would have a similar structure. The type field will say
clickhouse, the message will contain details around the exception.
Contrarily to the query validation errors, in case of Clickhouse errors, the
query is actually executed, so all the timing and stats details described for
successful query are present.
Creating a Subscription query
Send the payload as a POST to 127.0.0.1:1218/[DATASET NAME]/[ENTITY NAME]/subscriptions.
Request Format
A subscription query would generally have this payload format:
{
    "project_id": 42,
    "time_window" : 150,
    "resolution" : 60,
    "query" : "MATCH (events) SELECT ...."
}
project_id, resolution, time_window are all specified as separate fields in the subscription payload by the user, alongside the query. This allows us to pre-build one subscription query and vary these as separate parameters.
‘time_window’ becomes part of the query condition (i.e the WHERE), and the subscription query will look at the past ‘time_window’ seconds (as specified by the window) of events. For example, if ‘time_window’ = 60, the subscription query will select rows whose timestamp column’s values fall in the range of [start - 60 seconds, start) where ‘start’ is defined as the timestamp at which the subscription was created. As ‘time_window’ increases, the larger the range of accepted values for the relevant timestamp column.
‘project_id’ becomes part of the query condition, and the query will filter records by matching on the specified id.
‘resolution’ is used to determine when the scheduler creates tasks so that the executor can run subscription queries. The scheduler can either schedule the subscription immediately, or can schedule subscriptions with a jitter (see JitteredTaskBuilder defintion for more details). For scheduling, a running timestamp is maintained and in the case of immediate scheduling, a subscription task is scheduled every ‘resolution’ seconds.
